NeuXtalViz#
NeuXtalViz (new-crystal-vis) is a tool for visualizing and interacting with neutron single crystal diffraction data.
It is built on top of Mantid. On any analysis system node, the software can be opened through the application shortcut.

Analysis server login.#
The shortcut is under applications/analysis.
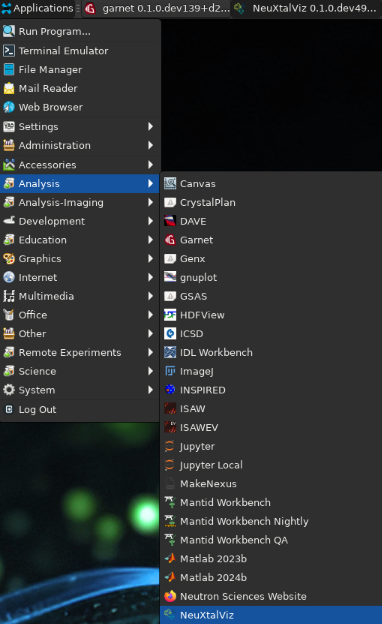
NeuXtalViz (and garnet) application shortcut.#
Crystal Structure#
The first application allows for the generation of a crystal structure by loading a CIF file.
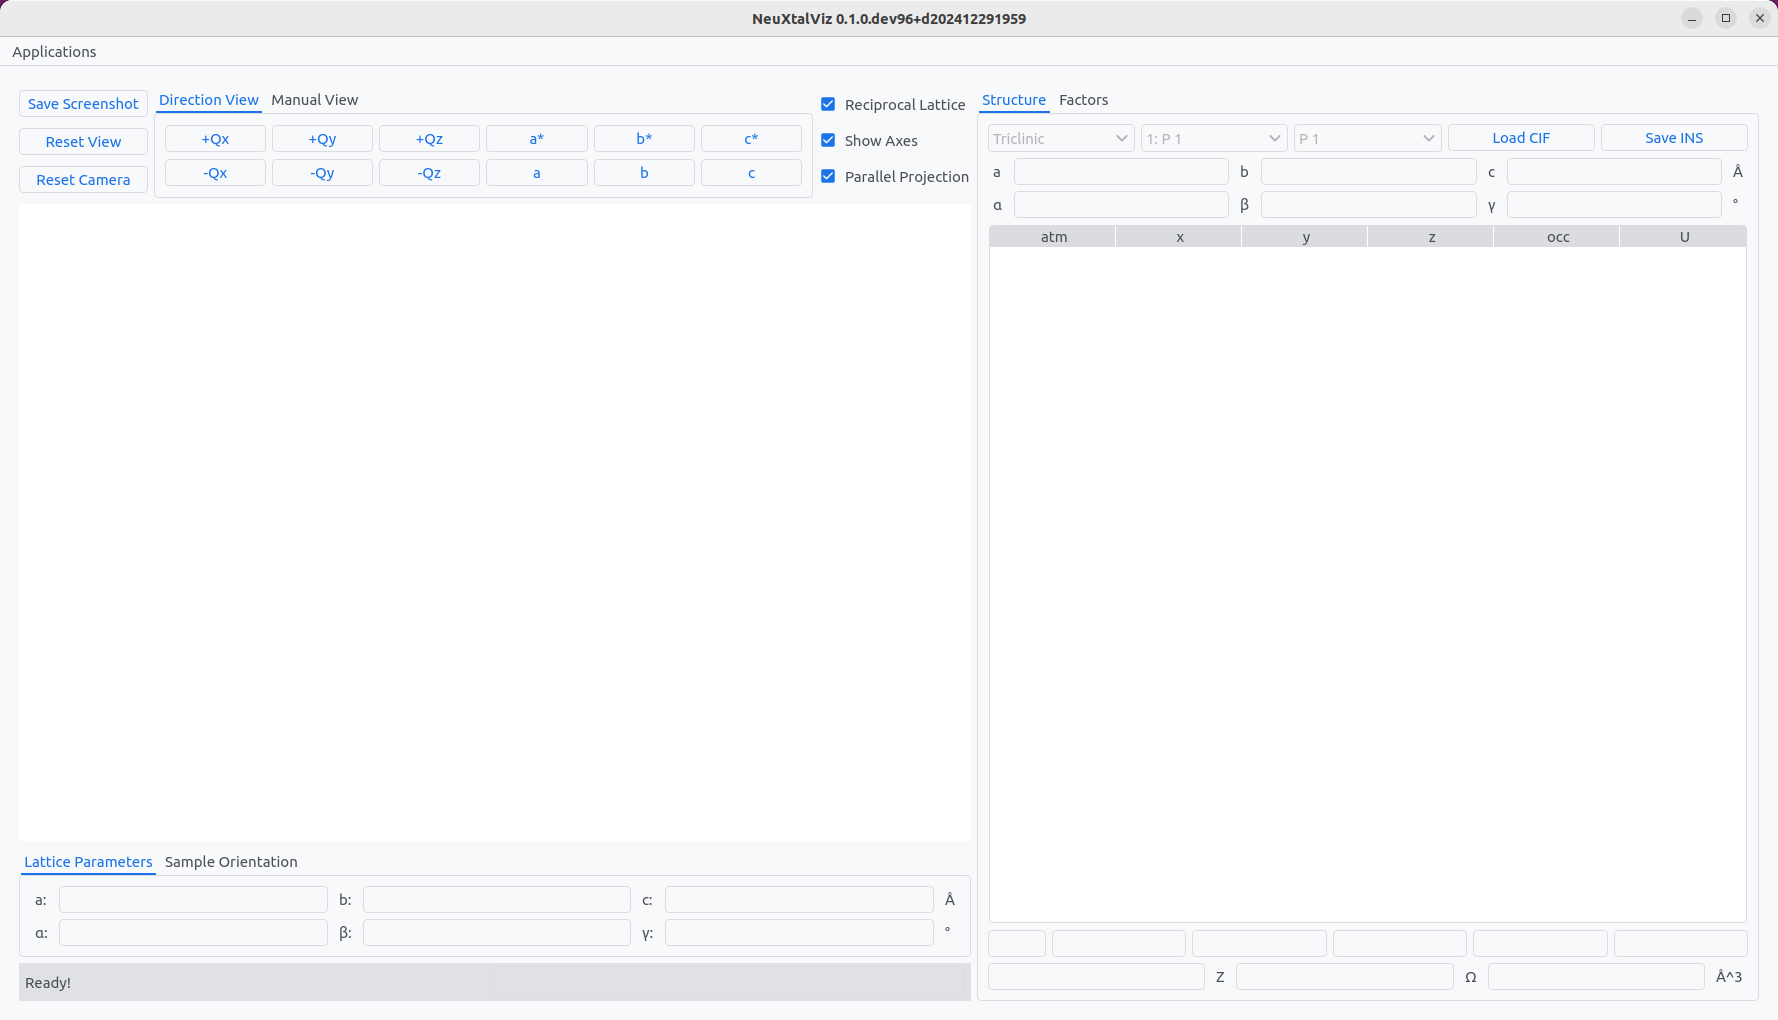
The Crystal Structure application.#
Click Load CIF and navigate to a valid CIF file. In this example, a rare-earth garnet crystal is loaded.
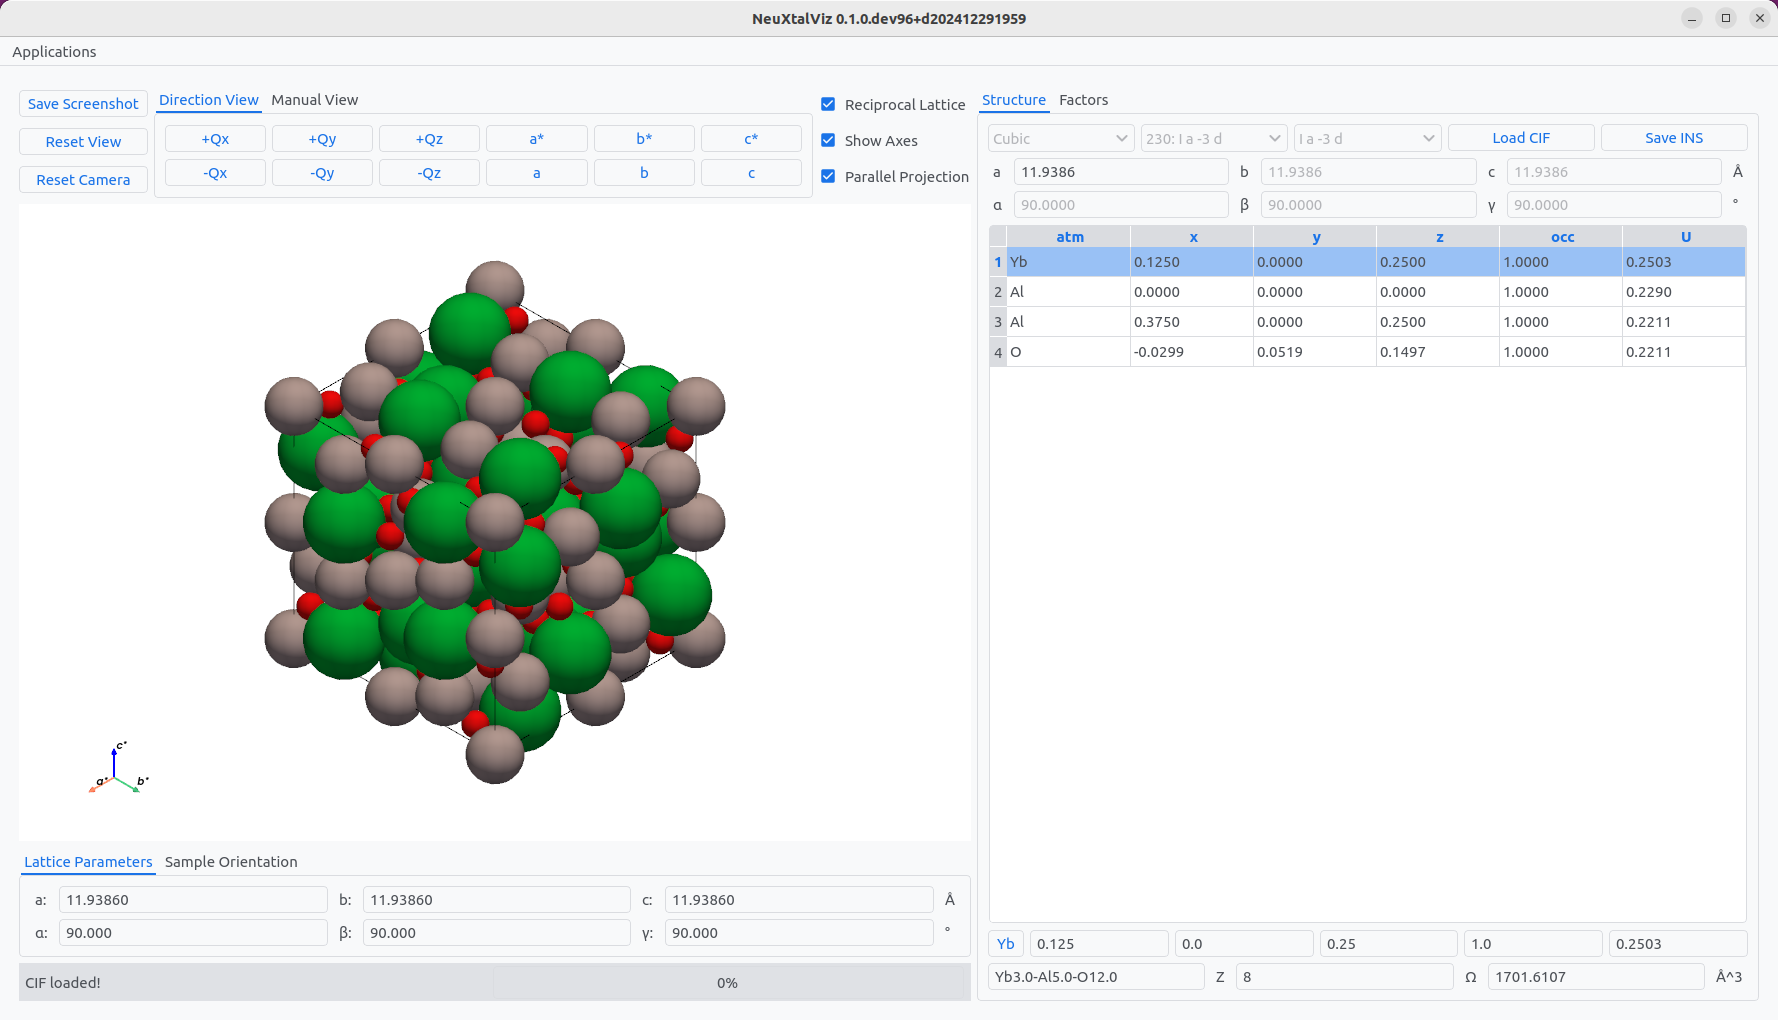
Yb₃Al₅O₁₂ (Ia-3d).#
The table on the left displays the atom site information that may be modified. For example, click on Yb atom row, and click on the Y button to change to another rare-earth garnet Y₃Al₅O₁₂.
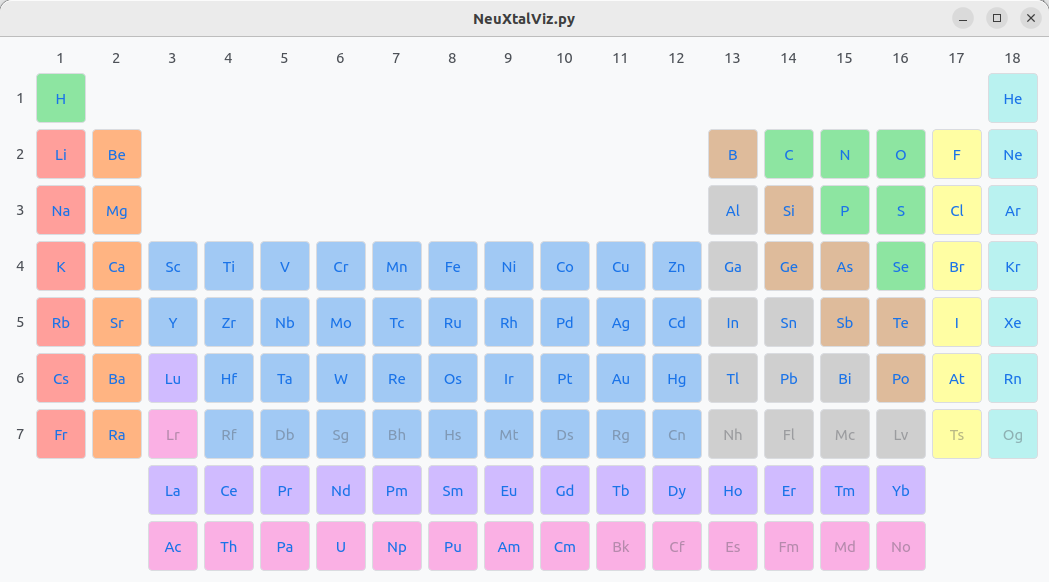
Perioidic table.#
Click on Y atom and select the isotope. By default, the natural abundance is chosen. The isotope can be selected by clicking Use Isotope.
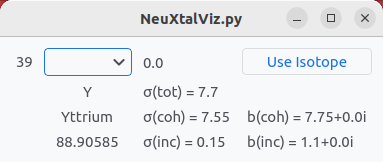
Isotope information.#
The unit cell is updated. The structure factors can be calculated by selecting the Factors tab. Enter the minimum d-spacing d(min), for example, using a lower limit of 0.7 Å. Click Calculate to observe the table populated with structure factors.
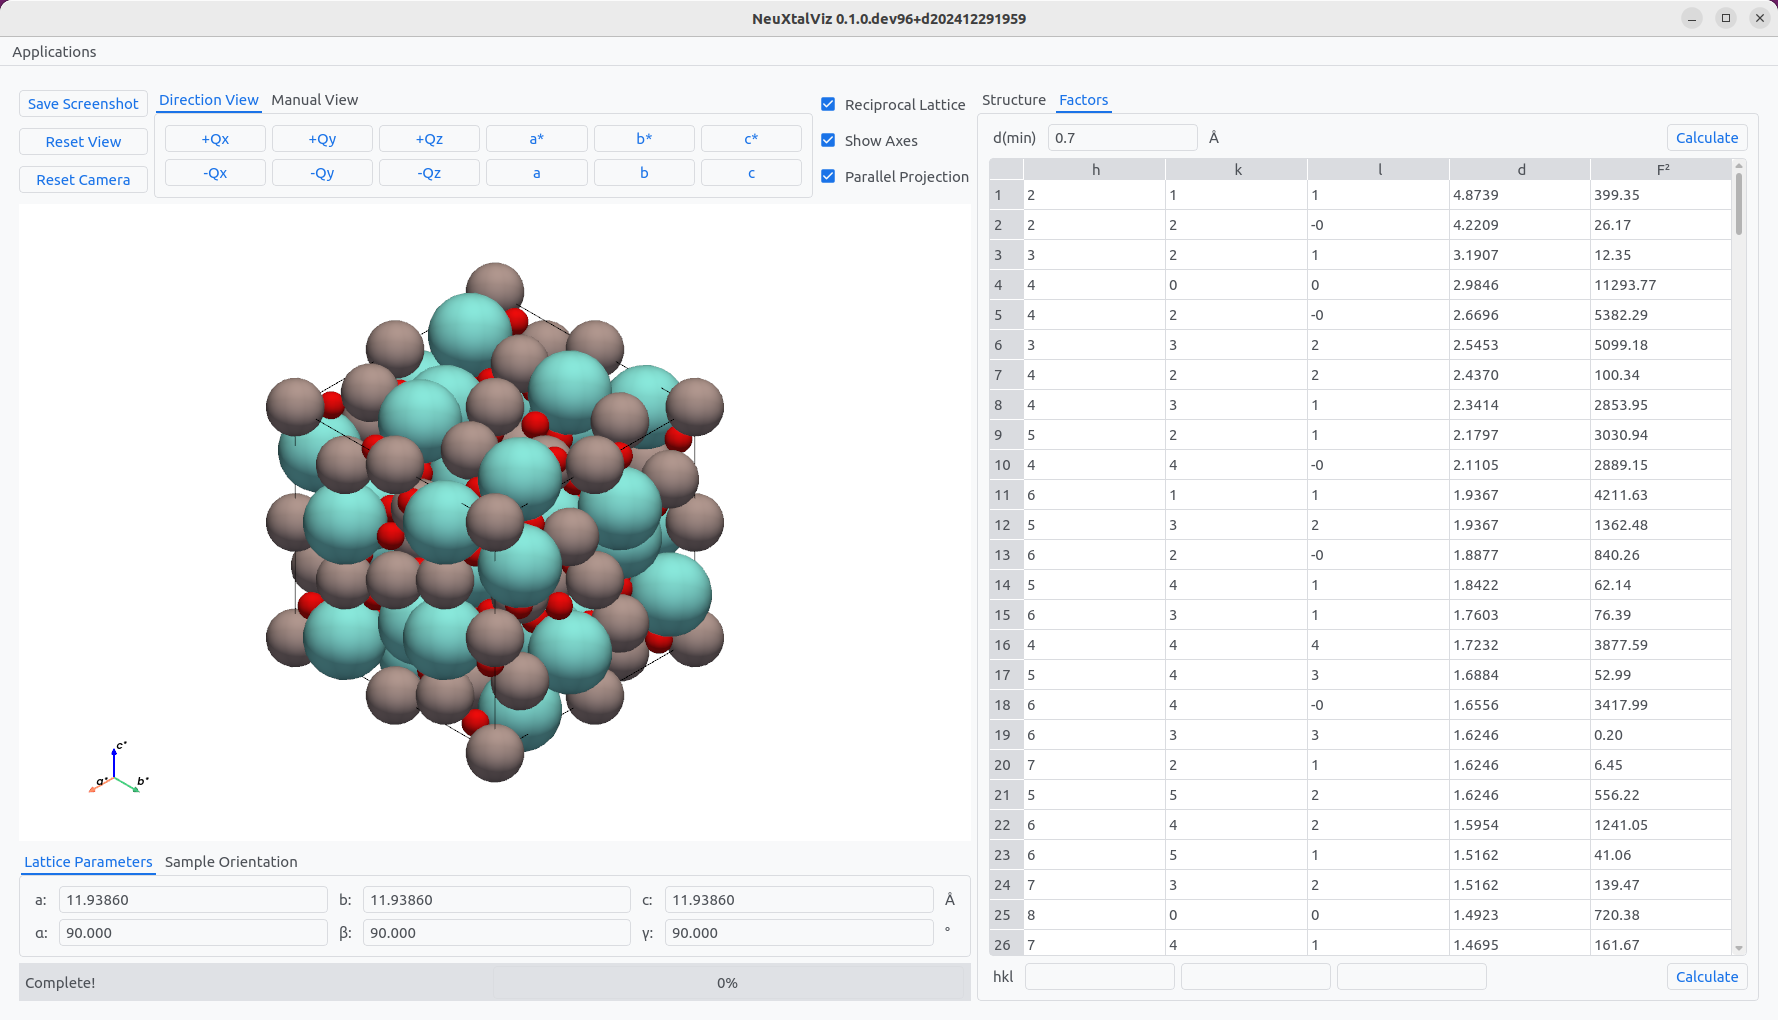
Calculating structure factors.#
Volume Slicer#
The volume slicer application enables reciprocal space data normalized into \(hkl\)-space to be visualized as a three-dimensional volume and supports slicing/cutting data into two-dimensional planar slices and one-dimensional line cuts.
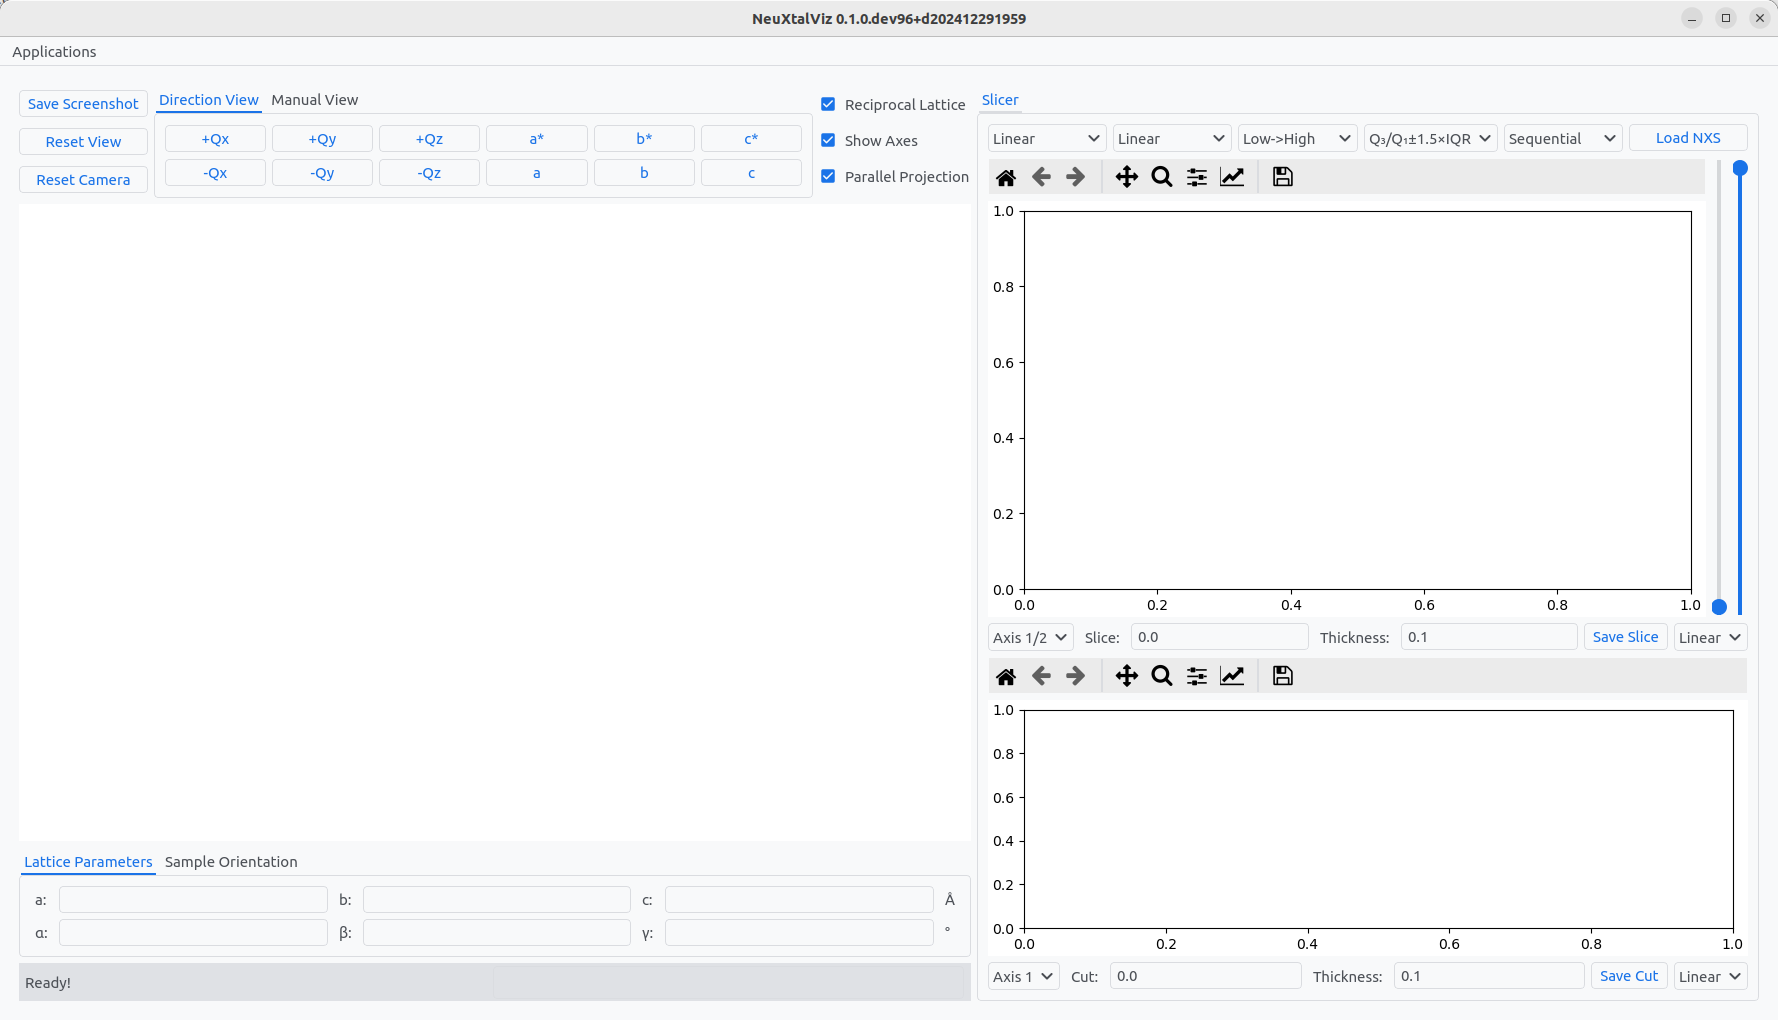
The Volume Slicer application.#
Load a dataset by clicking Load Nexus and navigating to a file. The file will be plotted in three-views: 3D volume, 2D slice plane, and 1D line cut.
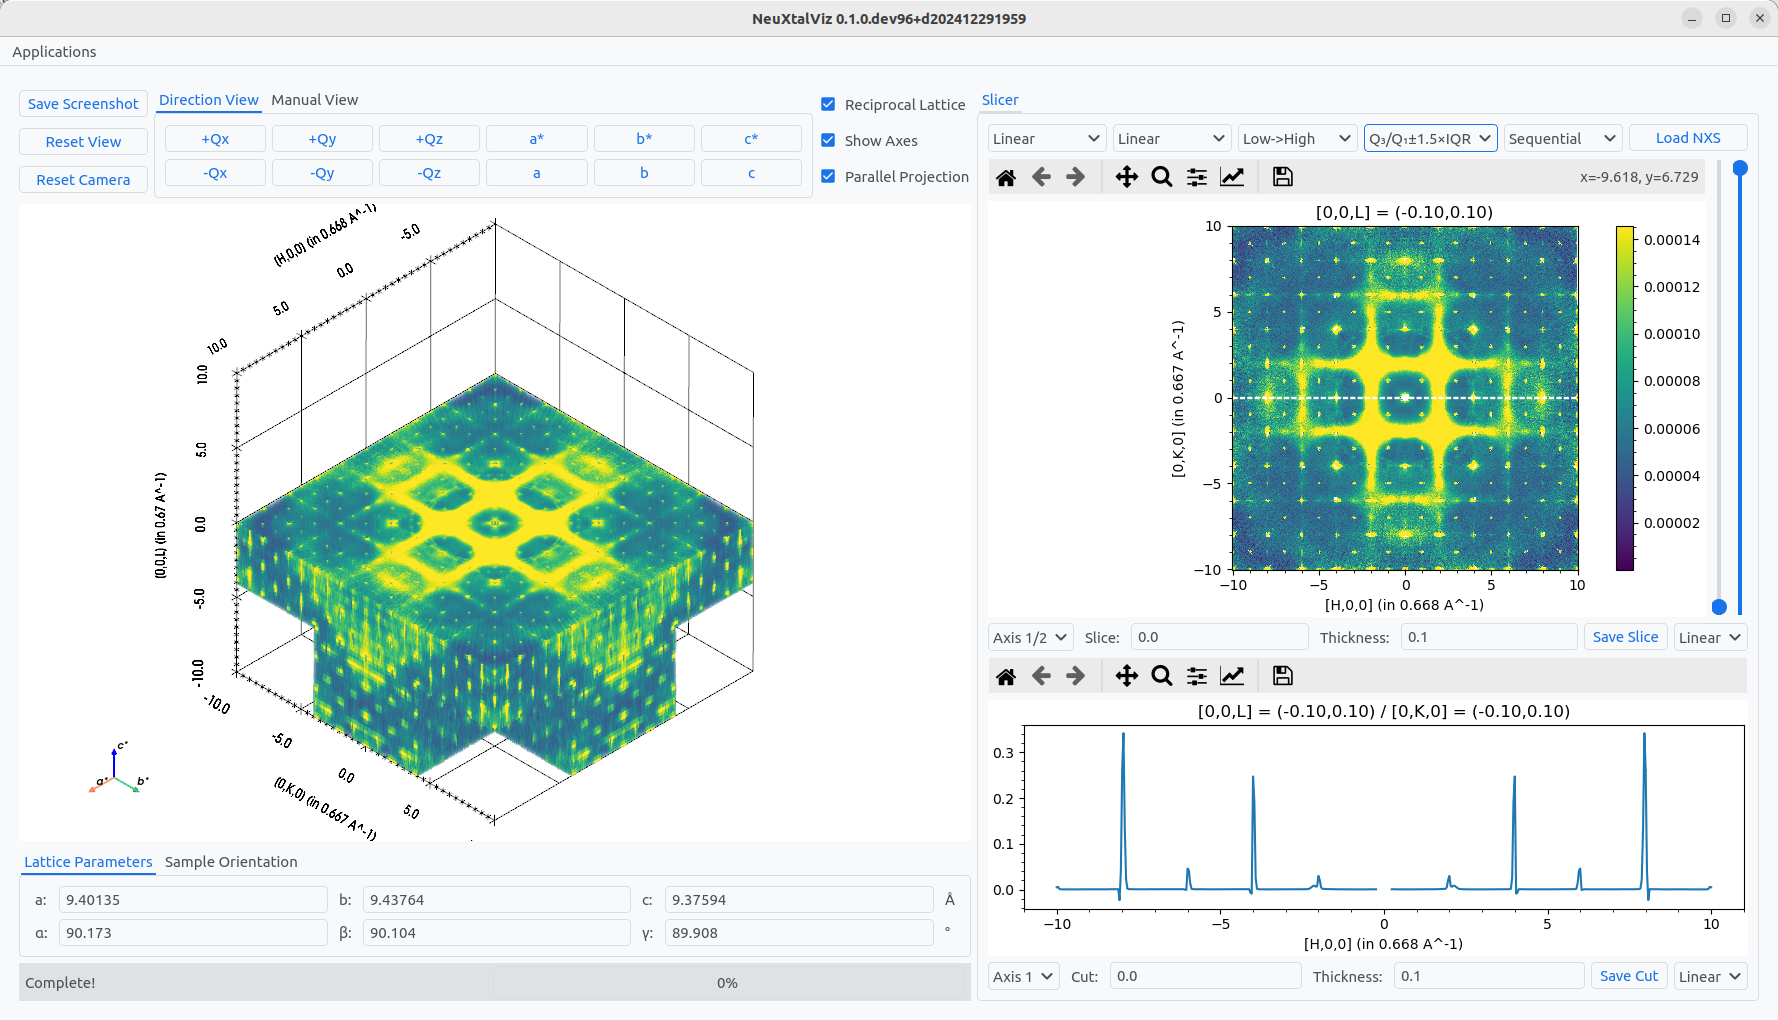
Viewing 3D-data with diffuse scattering.#
The slice value can either be adjusted by interacting with the 3D view or manually specfiying the Slice value. Similarly, the cut calue can be adjusted by interacting with the 2D view or manually specifiny the Cut value. The thickness of the of the plane and cut can also be adjused that increases the integration range.
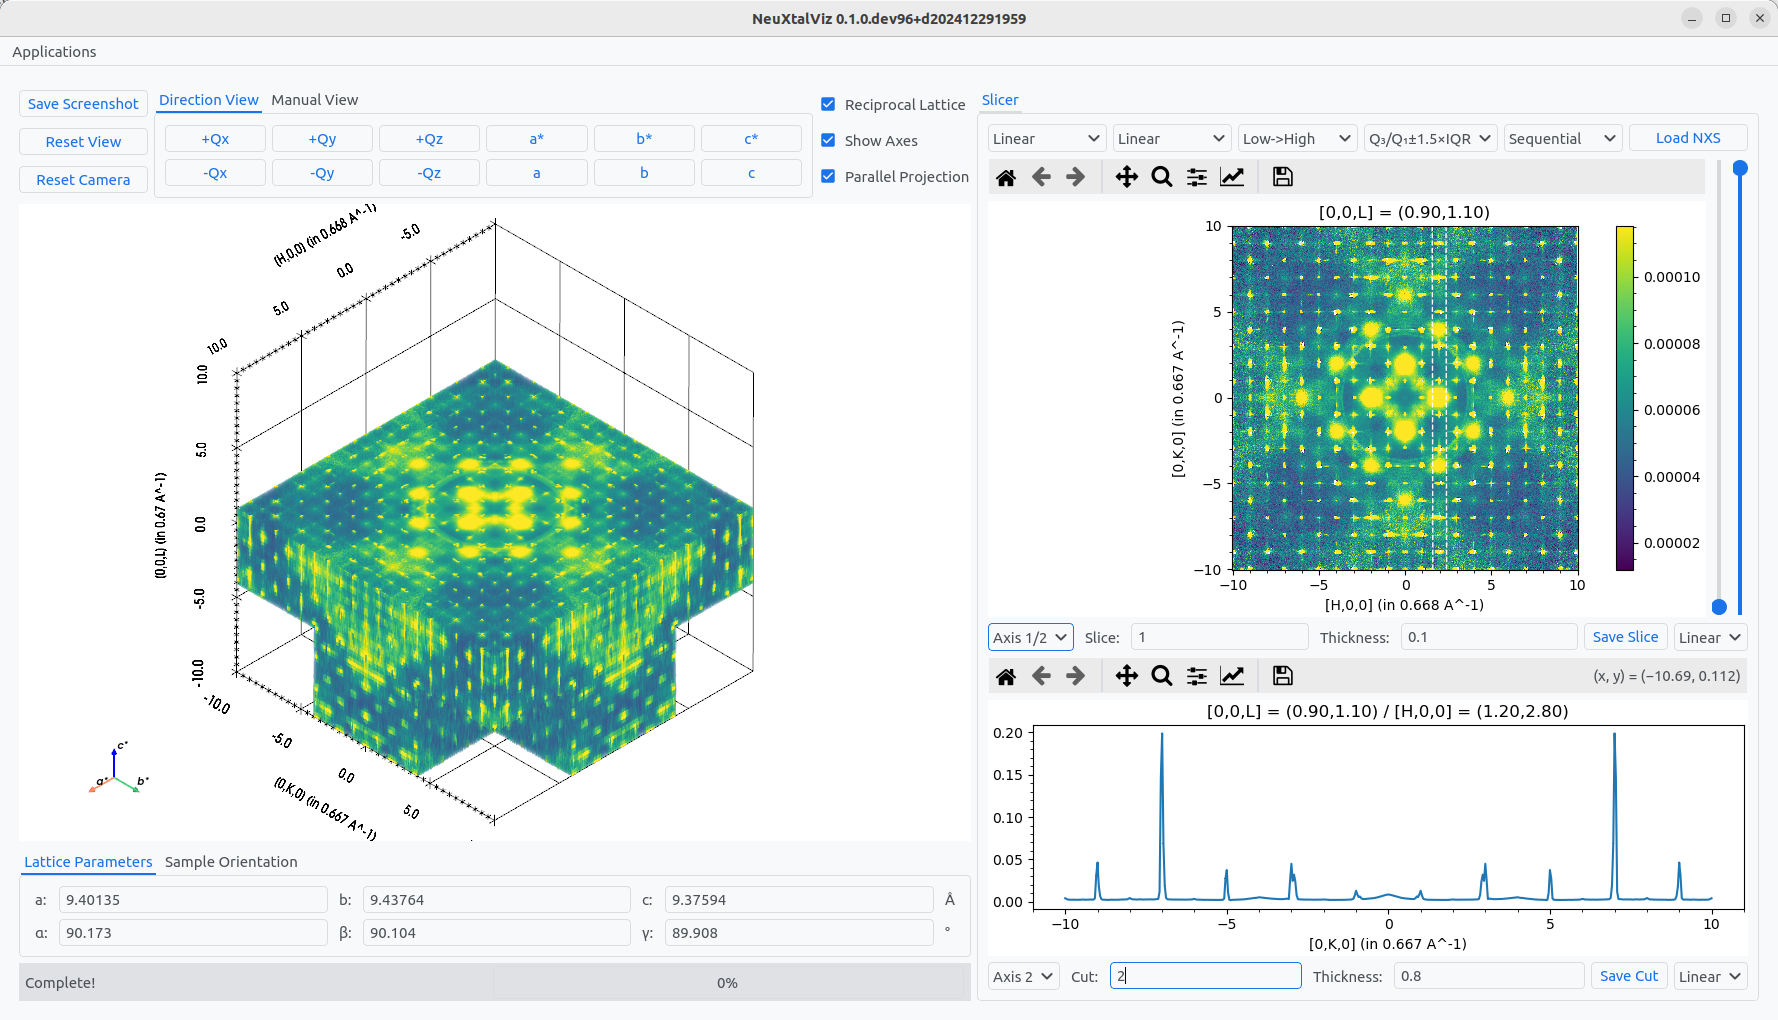
Specifying a slice and cut.#
The direction of the plane can can also be changed by selecting different Axis combinations.
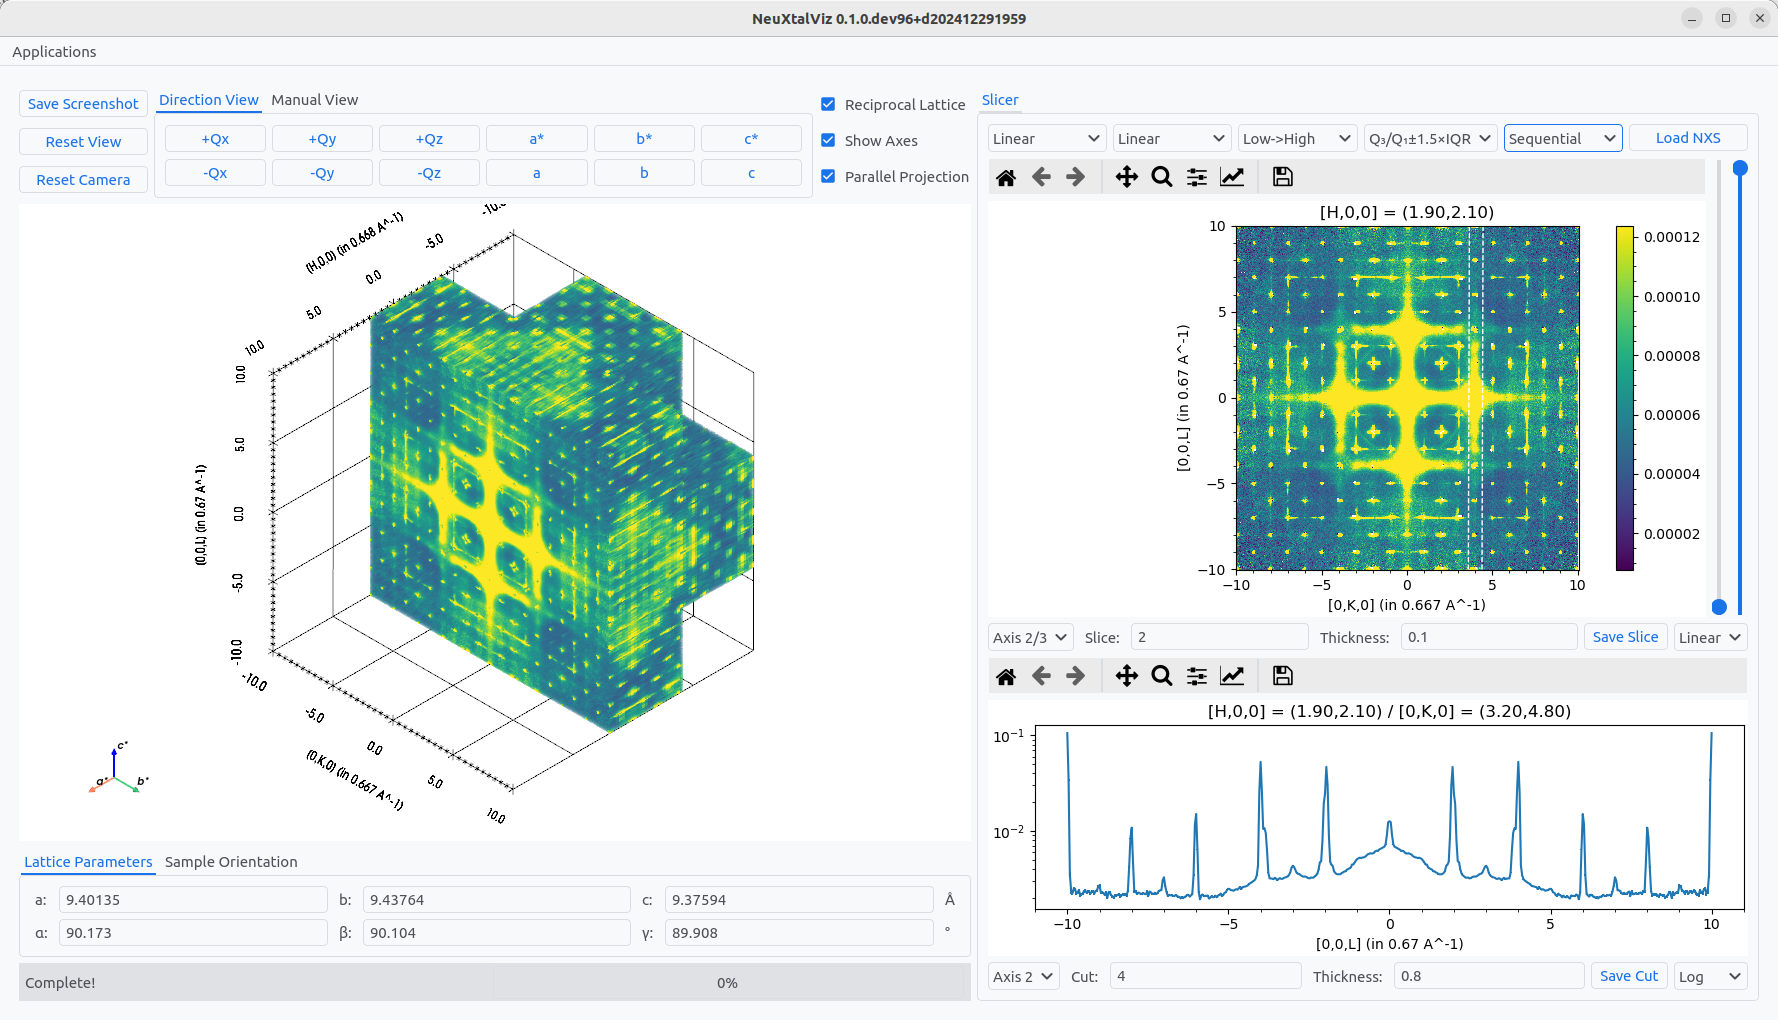
Choosing a different normal.#
The viewer also supports different ways to view the data using opacity, normalization scaling and clipping, and colormap. The slice and plan that are viewed can be save to a text file using:
Save Slice
Save Cut
These remove the extra dimensionality and flattens the data. The columns are
(x1 / x2 / … / signal / error),
and the header comments describes how to reshape the columns back into the original shape.
UB#
The UB application is a tool for working with data, peaks, and UB-matrices. Several examples are shown below with Yb₃Al₅O₁₂.
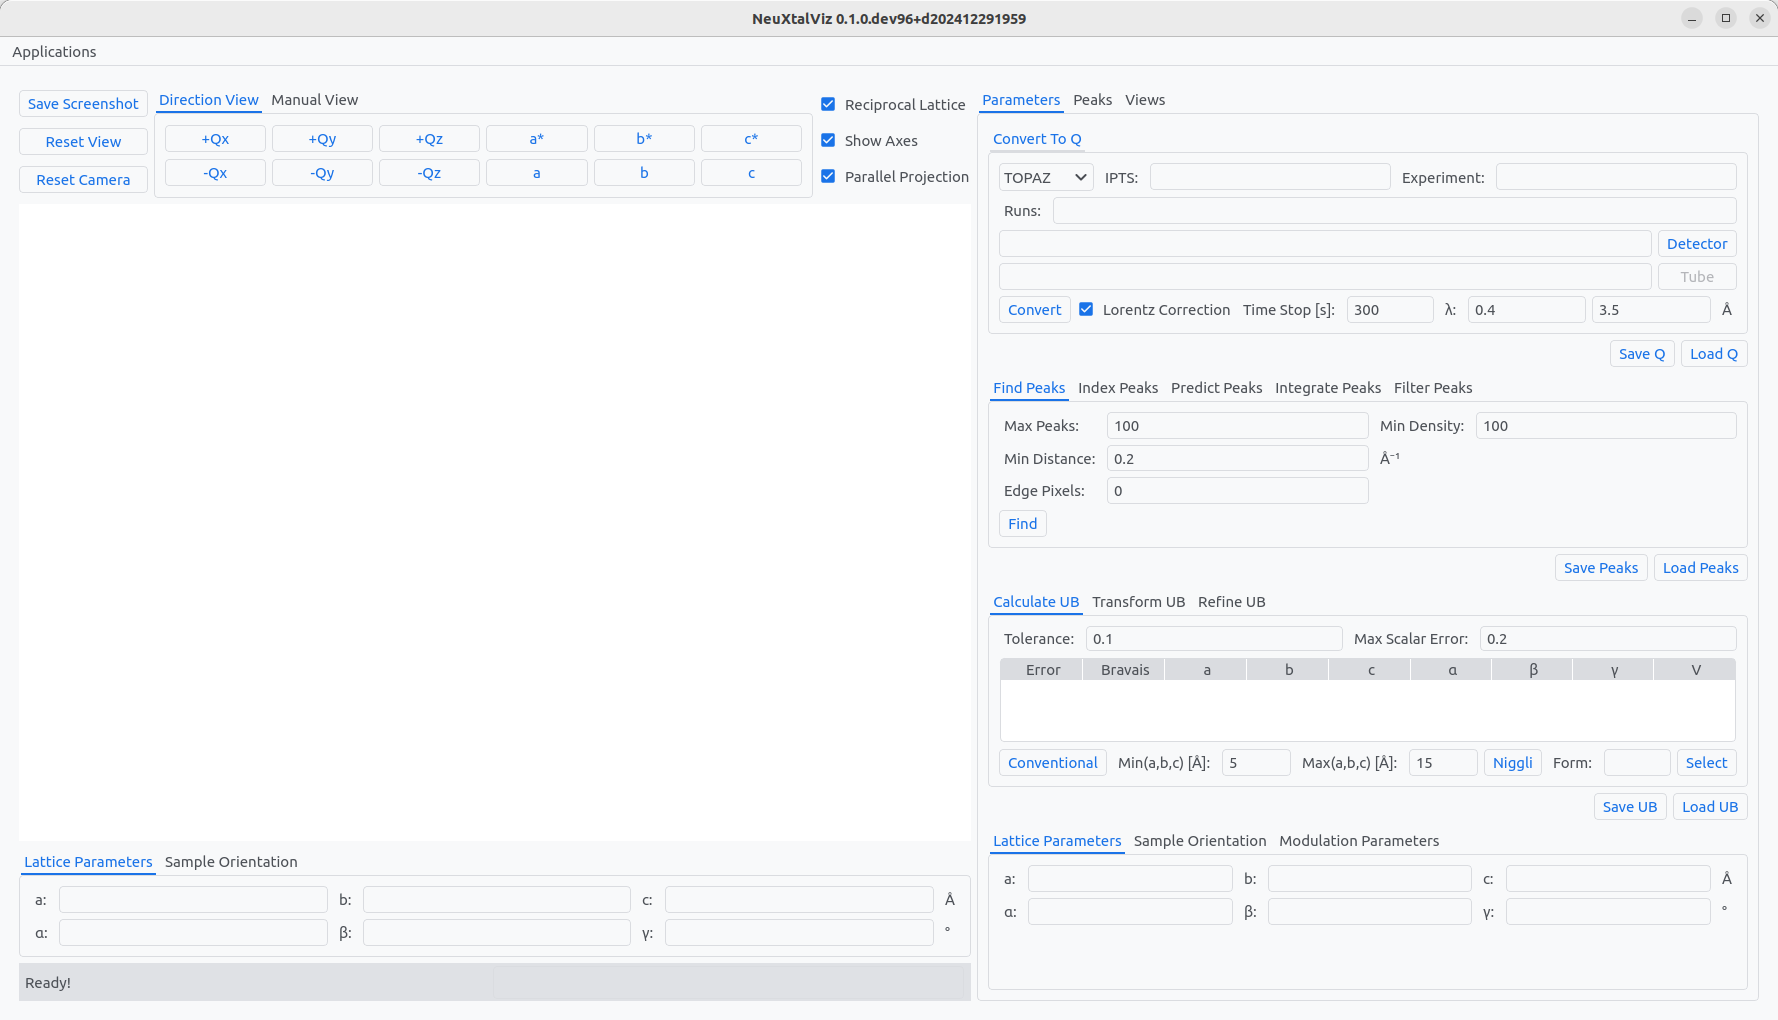
The UB application.#
TOPAZ-style#
For Laue diffraction data, an un-biased approach to determining the \(UB\) by choosing the best-fitting unit cell Bravais lattice. This TOPAZ example covers:
Converting data to reciprocal space
Finding peaks from reciprocal space
Calculating Niggli cell \(UB\)-matrix
Transforming to conventional cell
Refining \(UB\)
Verifying miller indices \(hkl\).
Enter the IPTS experiment number and Run numbers. Optionally, load the detector calibration DetCal file. Click Convert to reciprocal space data. Then, Find peaks modifying the peak distance threshold, maximum number of peaks, and minimum signal density. The peaks are overlayed on top of the data in a light-blue color. To determine the Niggli cell, the minimum and maximum lattice-spacings must be entered before clicking Niggli.
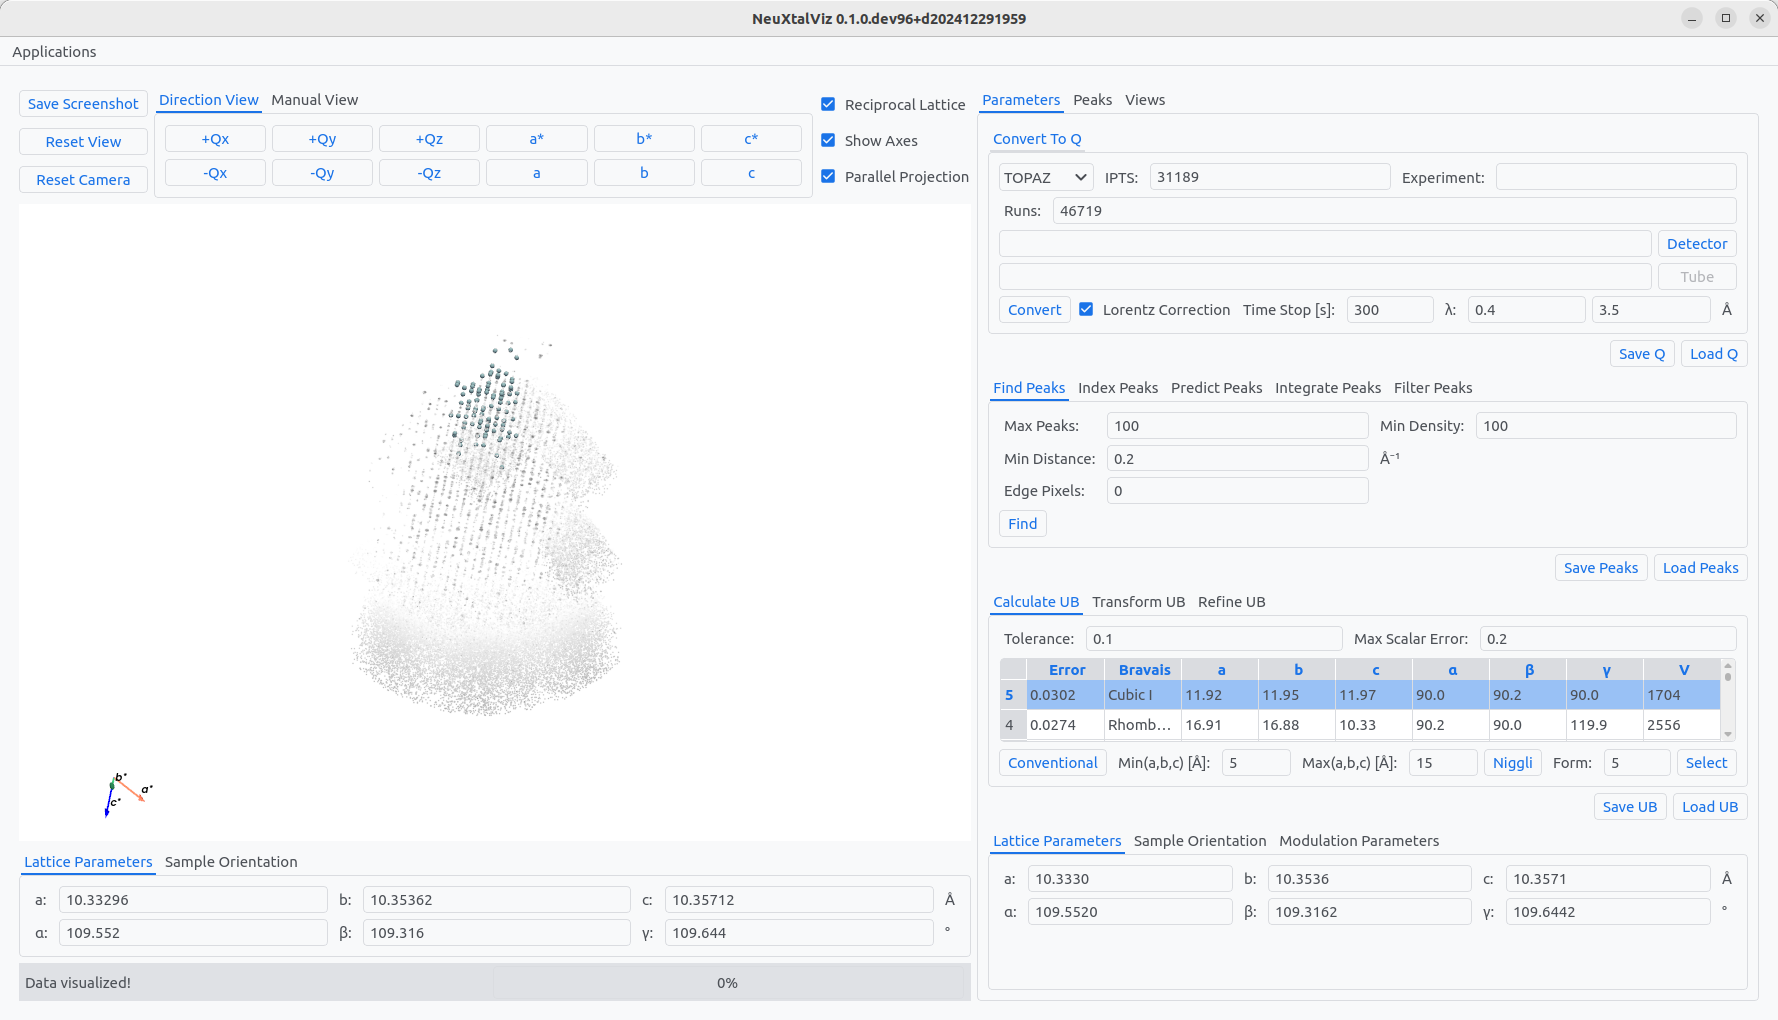
The table shows possible cells Bravais lattice that could correspond to the determined UB. The row of the Bravais lattice can be clicked to automatically populate the form number. Click Select to transfrom to the conventional cell. The indexed peaks are now colored in light-green. Choose the Refine UB tab, select Cubic constraint, and then click Refine to enforce cubic lattice parameters.
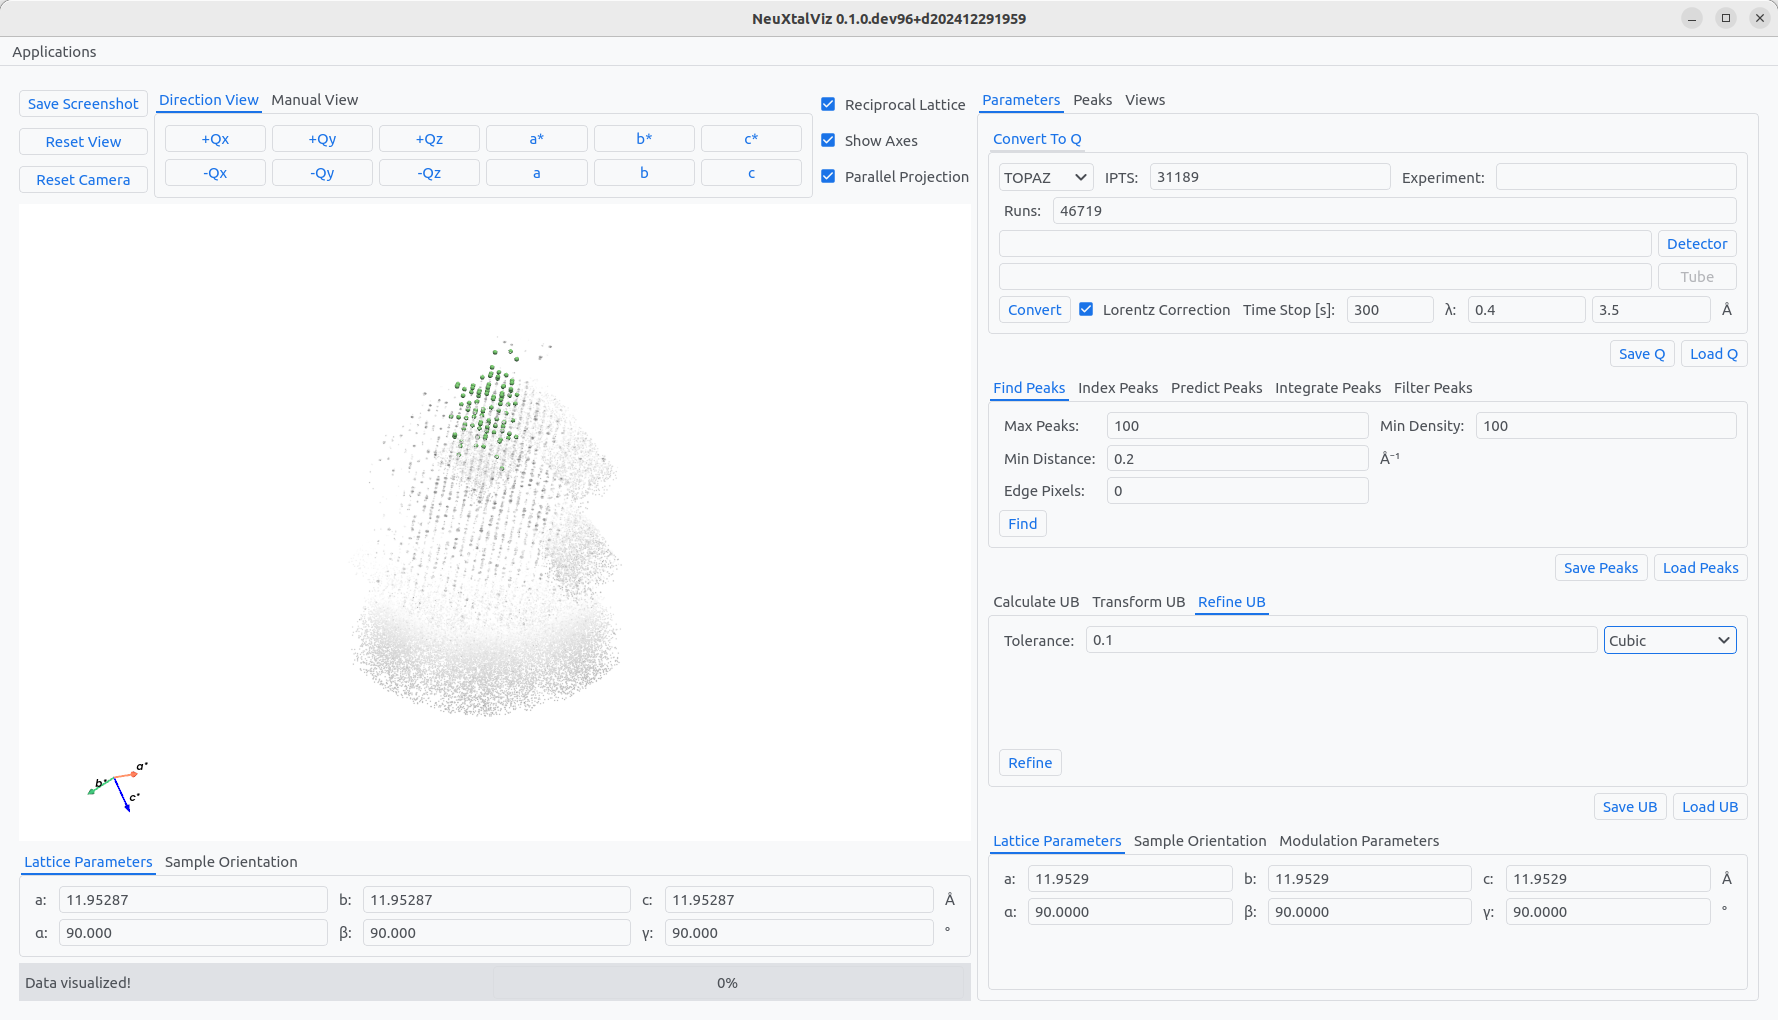
Transforming to conventional cell and applying constraints.#
Choose the View tab Slive View and select and axes plane to verify the predicting of integer Miller indices. Change the Slice value, slice Thickness and plane bin Width to modify the binning of the two-dimensional slice that can be generated by clicking Convert. Optionally, change the projection axes directions. The three-dimensional view can also be similarly alighned.
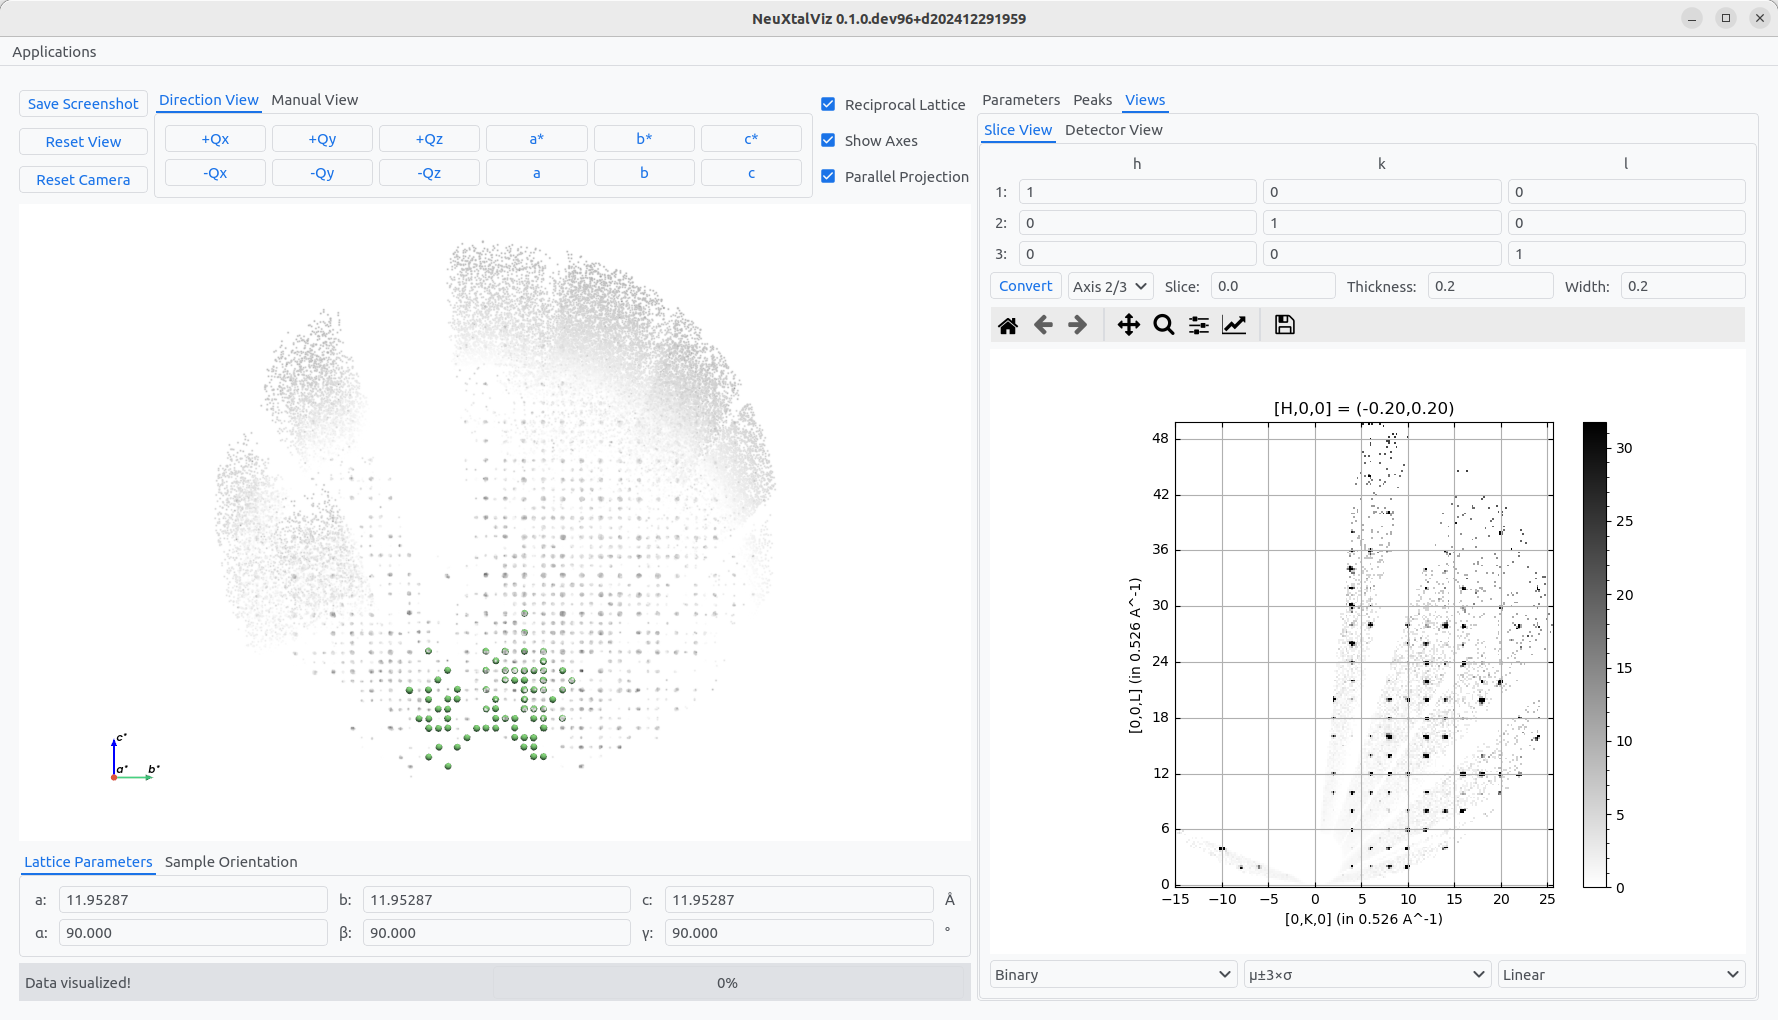
Verifying the UB.#
MANDI-style#
Another strategy for determining the \(UB\) from Laue data with easily resolvable strong peaks is by inputting the known lattice constants directly. This MANDI example covers:
Converting data to reciprocal space
Finding peaks from reciprocal space
Calculating conventional cell \(UB\)-matrix, directly
Refining \(UB\)
Verifying miller indices \(hkl\).
Follow a similar procedure as above, this time adjusting the wavelength band to 1 Å to 3 Å. The Min Distance is lowered to 0.1 Å, before using Find peaks. Enter the lattice paramters in the tab Lattice Parameters. For Yb₃Al₅O₁₂, the known parameters are \(a=b=c=11.93\) Å and \(\alpha=\beta=\gamma=90^\circ\). Click Conventional to determine the initial \(UB\).
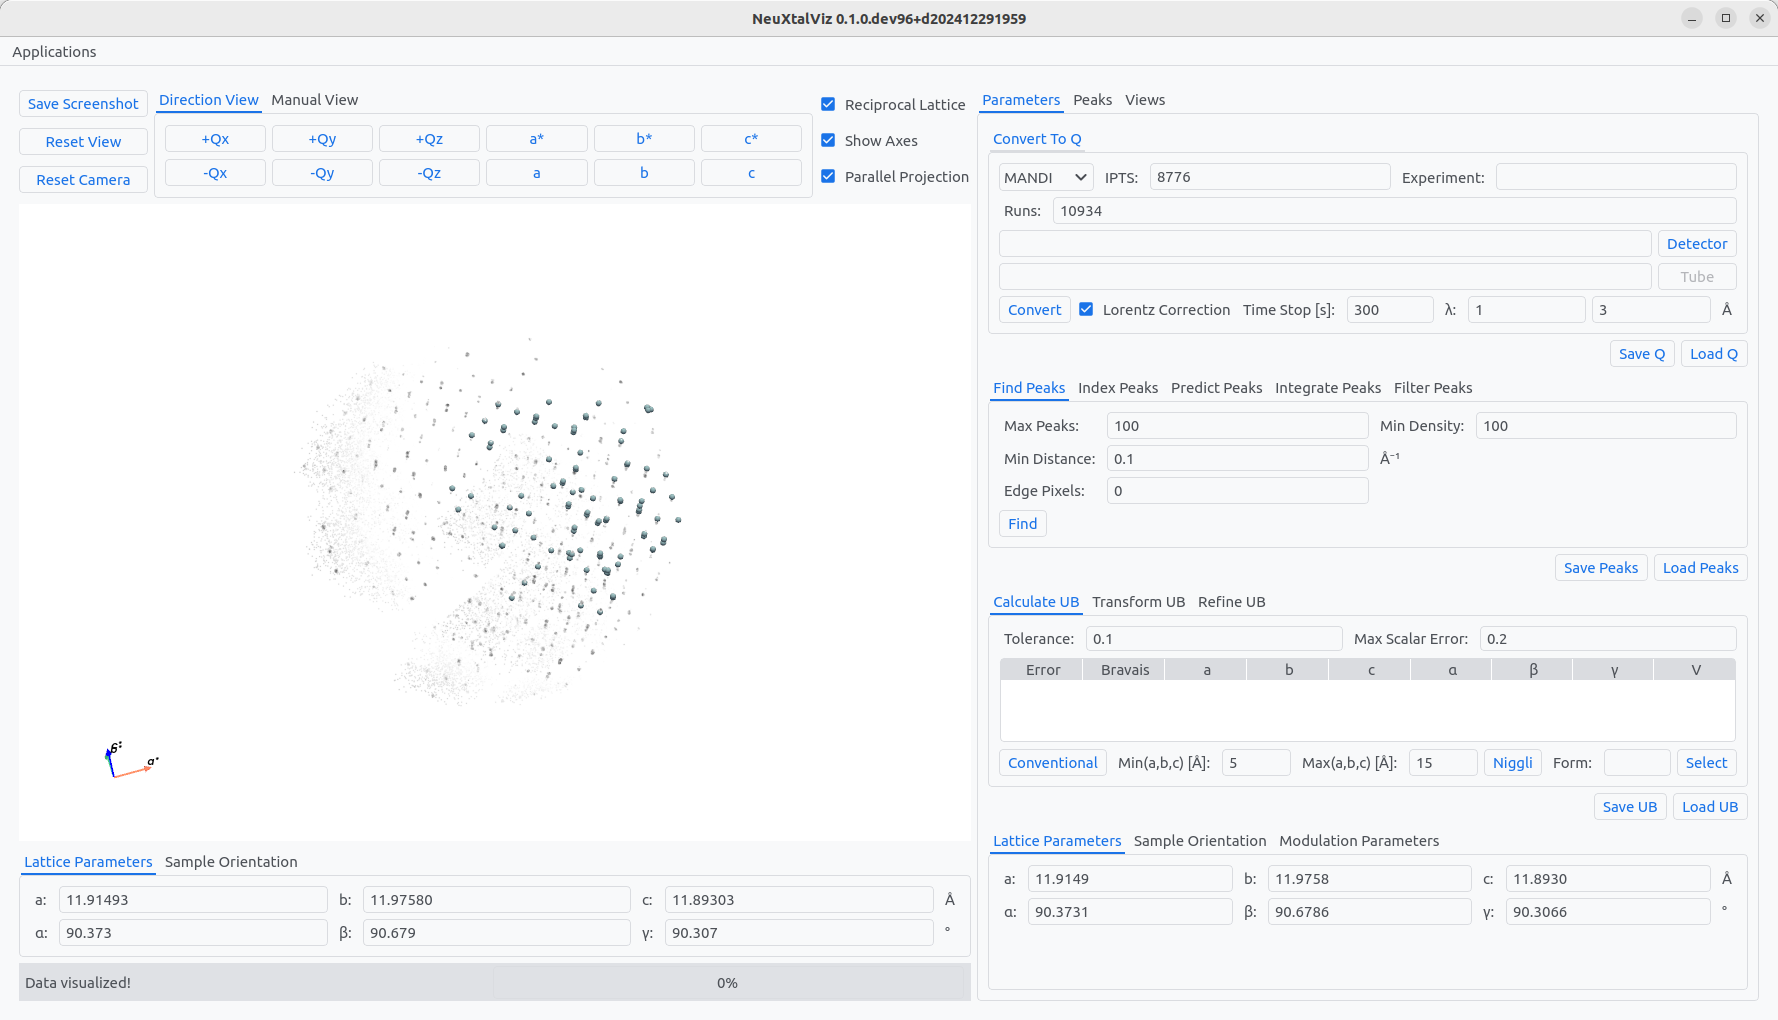
The paramters will be updated using the given constants as an initial guess. A similar procedure can be used to refine the lattice parameters constraining the constants. First, the peaks need to be indexed. Move to Index Peaks tab and click Index. To see the indexing of peaks, move to the Peaks tab and view the table. Indexed peaks will have integer Miller indices.
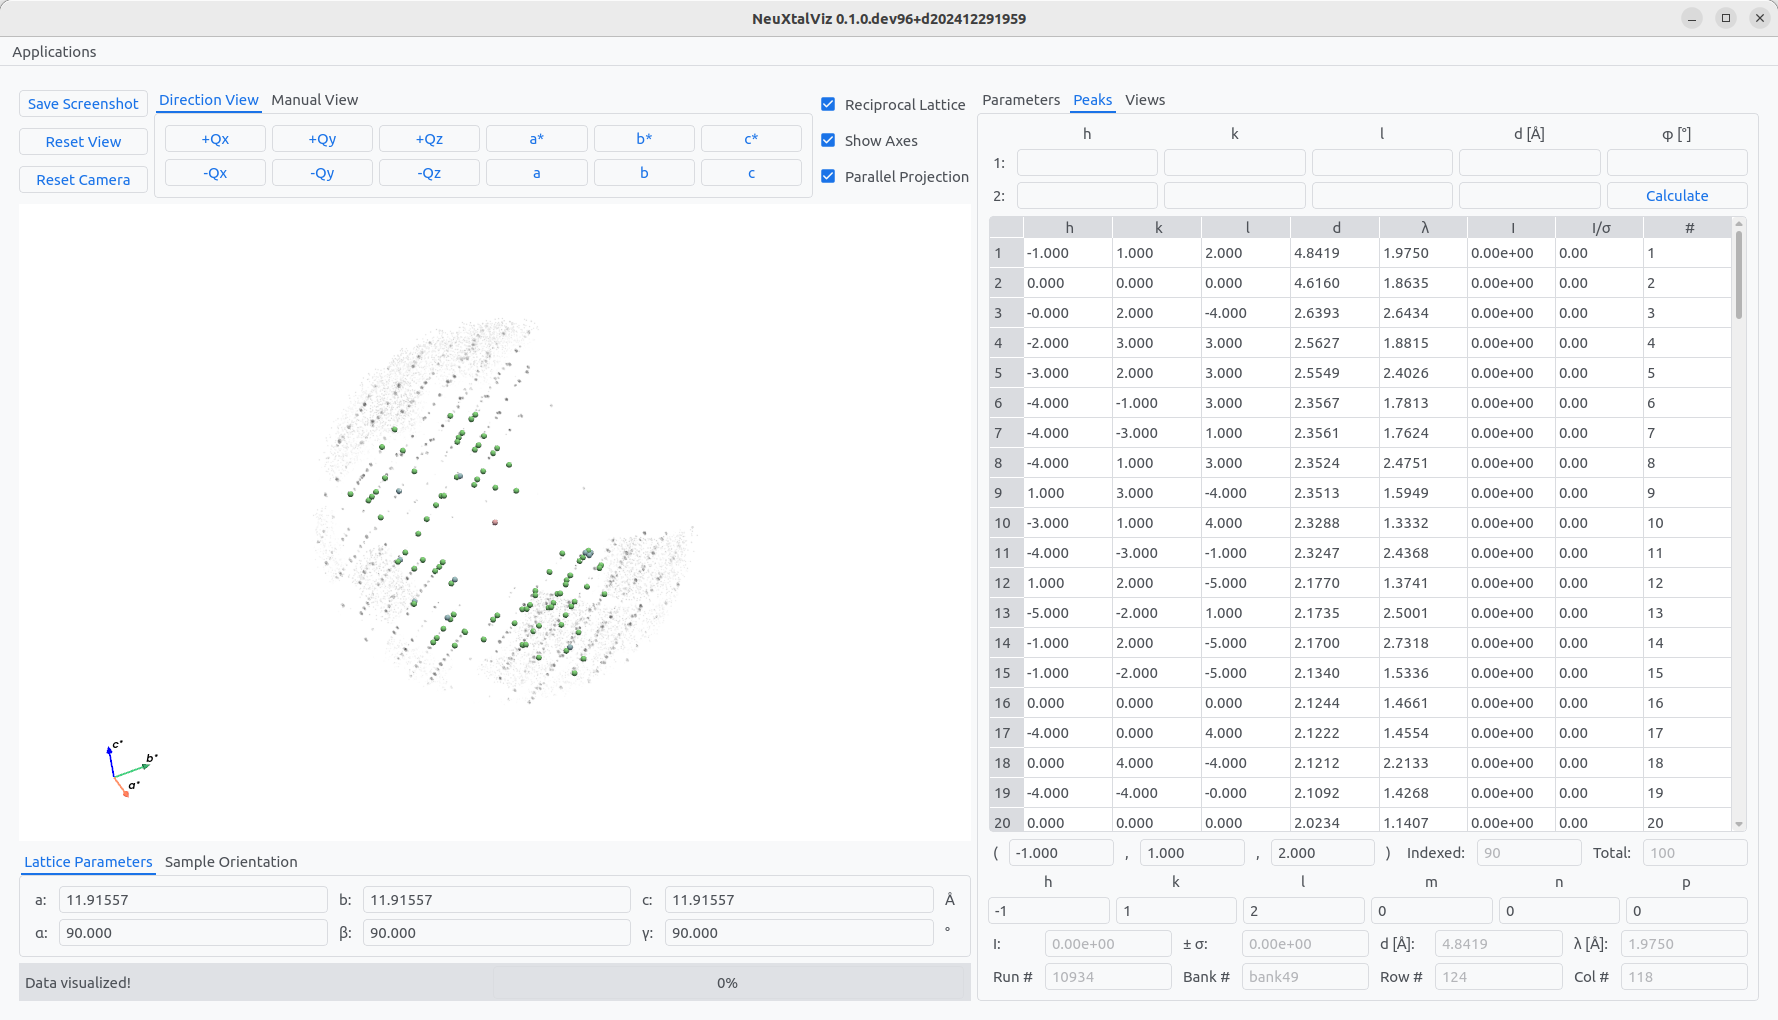
Click on a peak in the three-dimensional view or a row of the table to view additional information about the peak.
Indices
Run number
Bank number
Pixel row and column number
Wavelength
\(d\)-spacing
Integrated intensity
The number of indexed peaks out of total peaks is also given.
Experiment Planner#
The Experiment Planner is for selecting and optimizing goniometer settings given the rotational degrees-of-freedom of the goniometer.
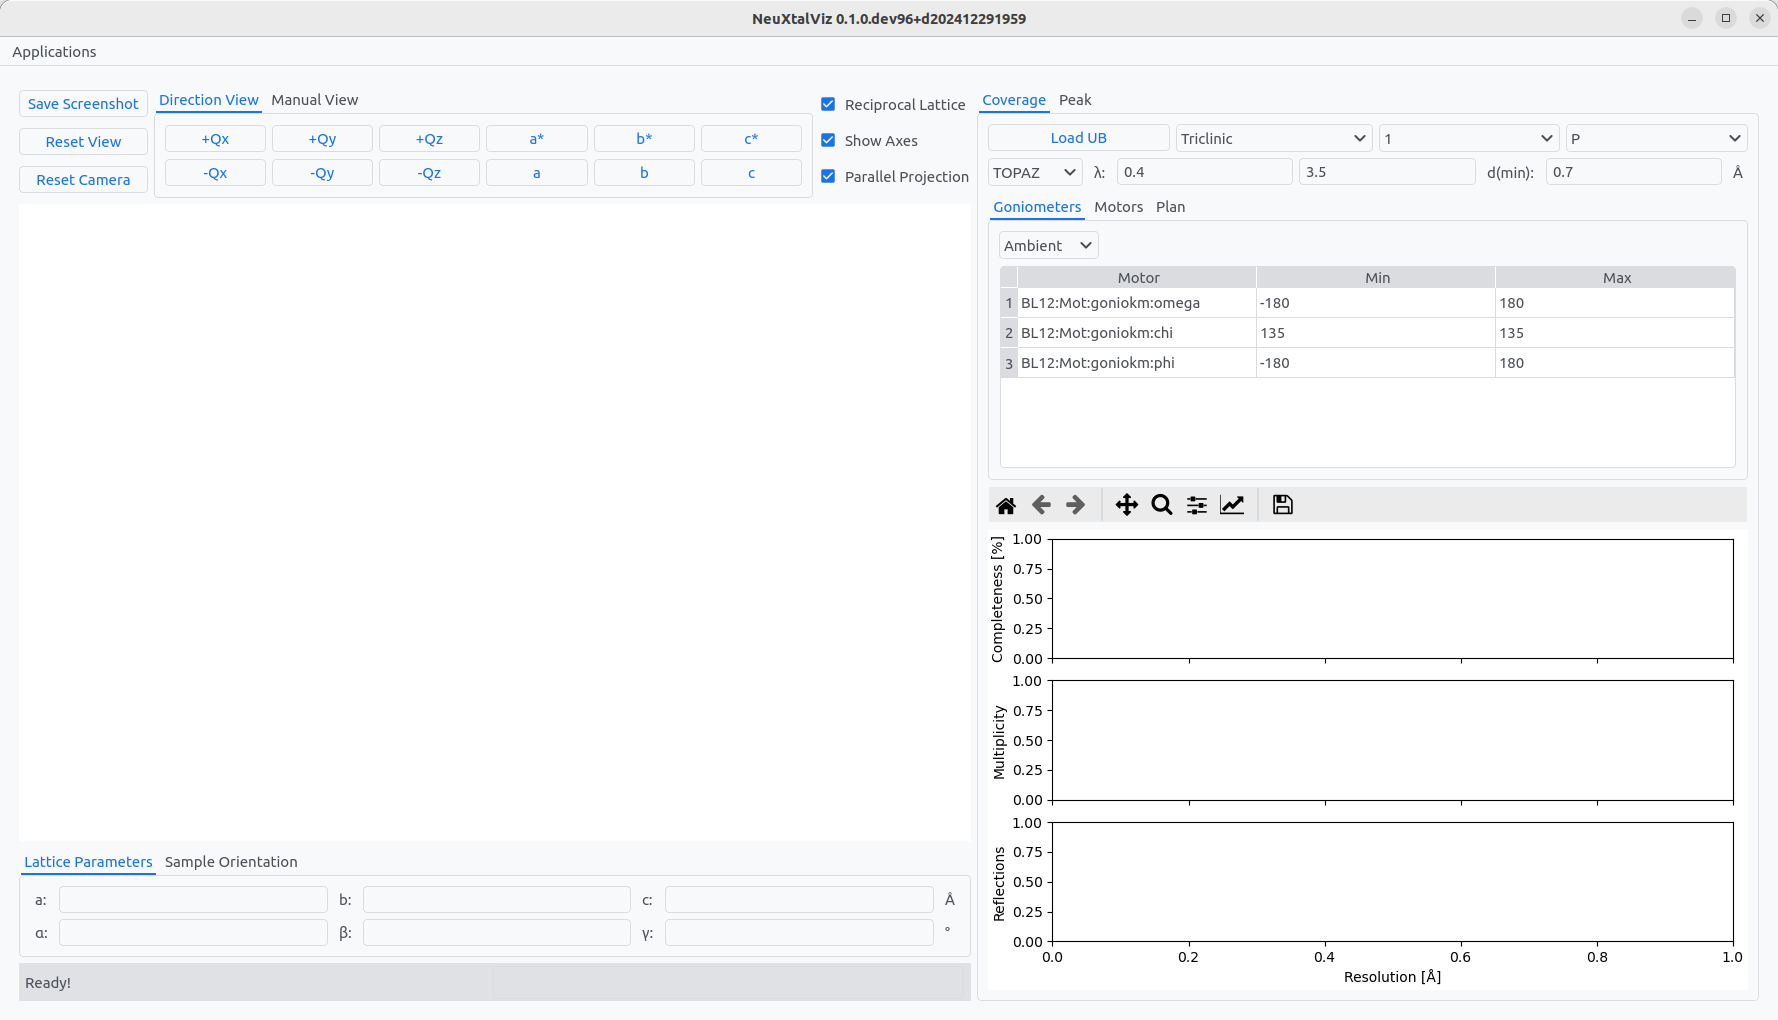
The Experiment Planner application.#
The first step is to select an Instrument and Load UB. In this example, a silicon UB will be used measured at TOPAZ. Optionally, the wavelength band and minimum d-spacing can be adjusted which affects the coverage calculation. For TOPAZ, the ambient goniometer with two degrees-of-freedom is chosen. Often, certain crystallographic directions can be placed on detector banks. Change to the Peak tab and enter a Miller index and click Individual Peak. The possible coverage of the peak on the instrument is shown colored by wavelength. Click on a region of the bank to place the peak there. The goniometer settings will be shown. Then, click Add Oriention to add it to the plan.
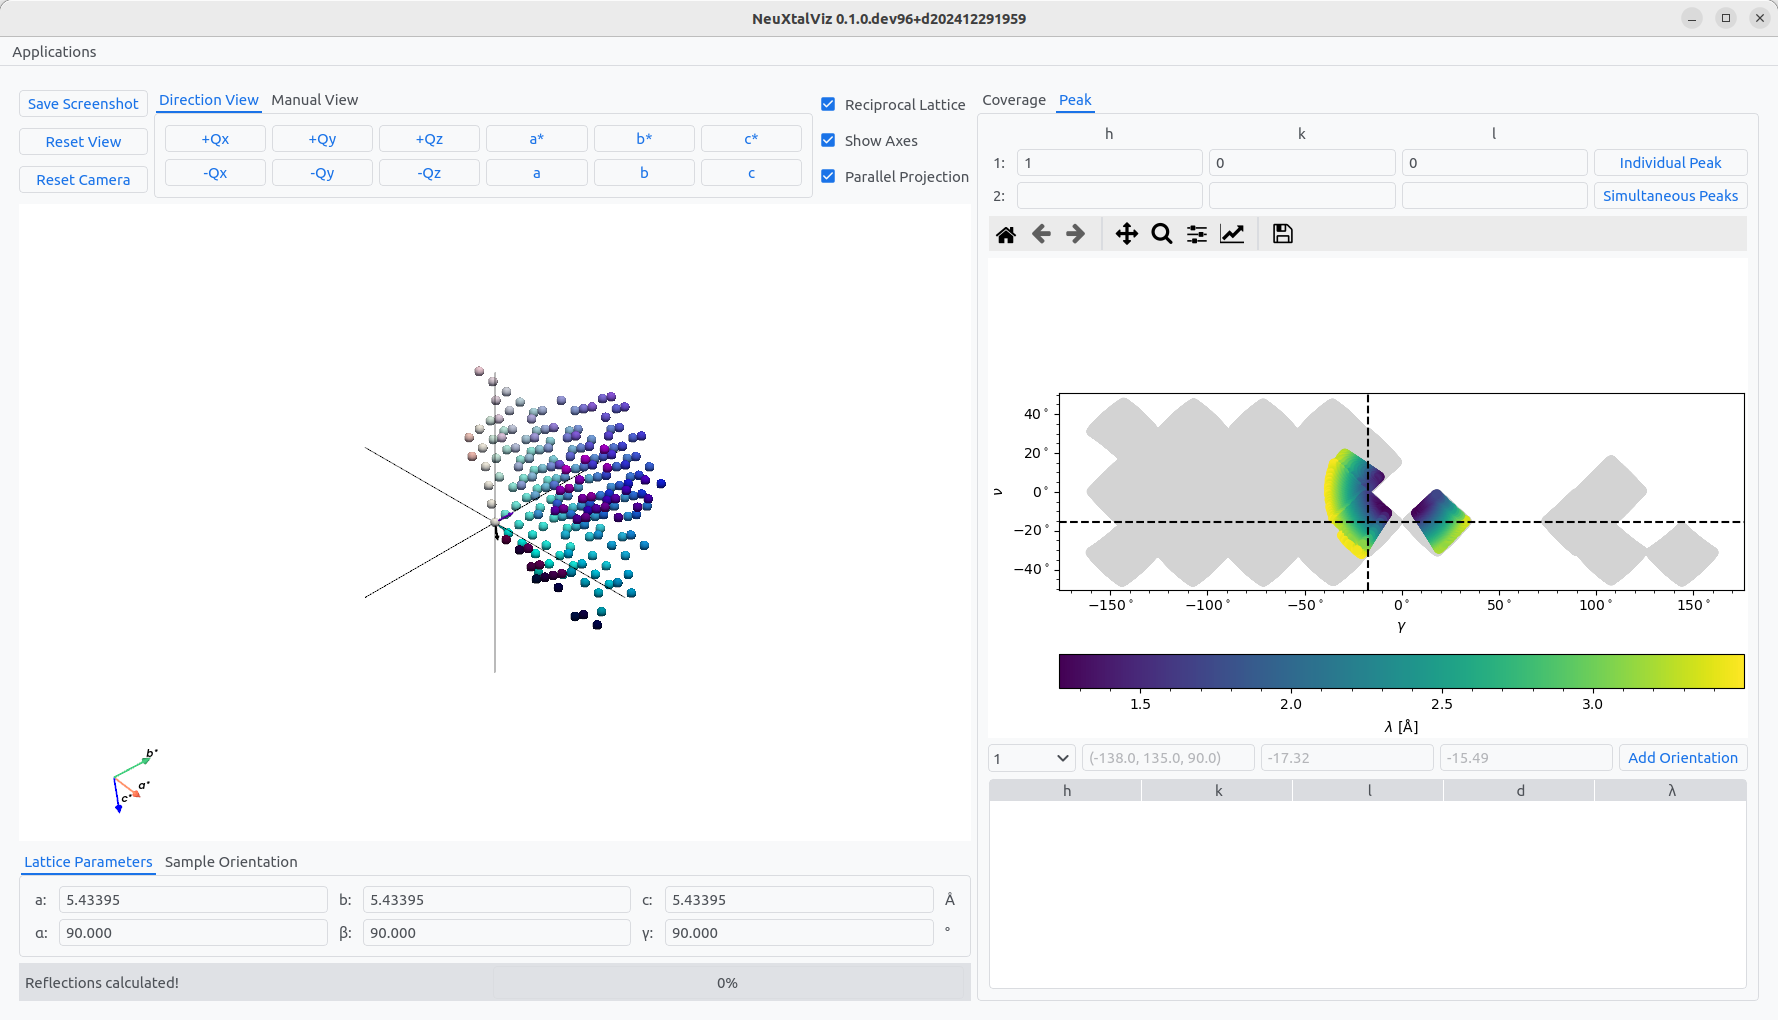
Placing a reflection on a detector.#
Moving back to the Coverage tab and Plan tab, the peak is shown as the first entry of the table. It is possible to add automatically optimized settings using a genetic algorithm. First, the symmetry of silicon Fd-3m can be enforced changing the crystal system to Cubic. Then, choose the point group m-3m and lattice centering F. Using 3 settings, the angles can be generated by clickling Optimize Coverage. The new settings will be added to the table.
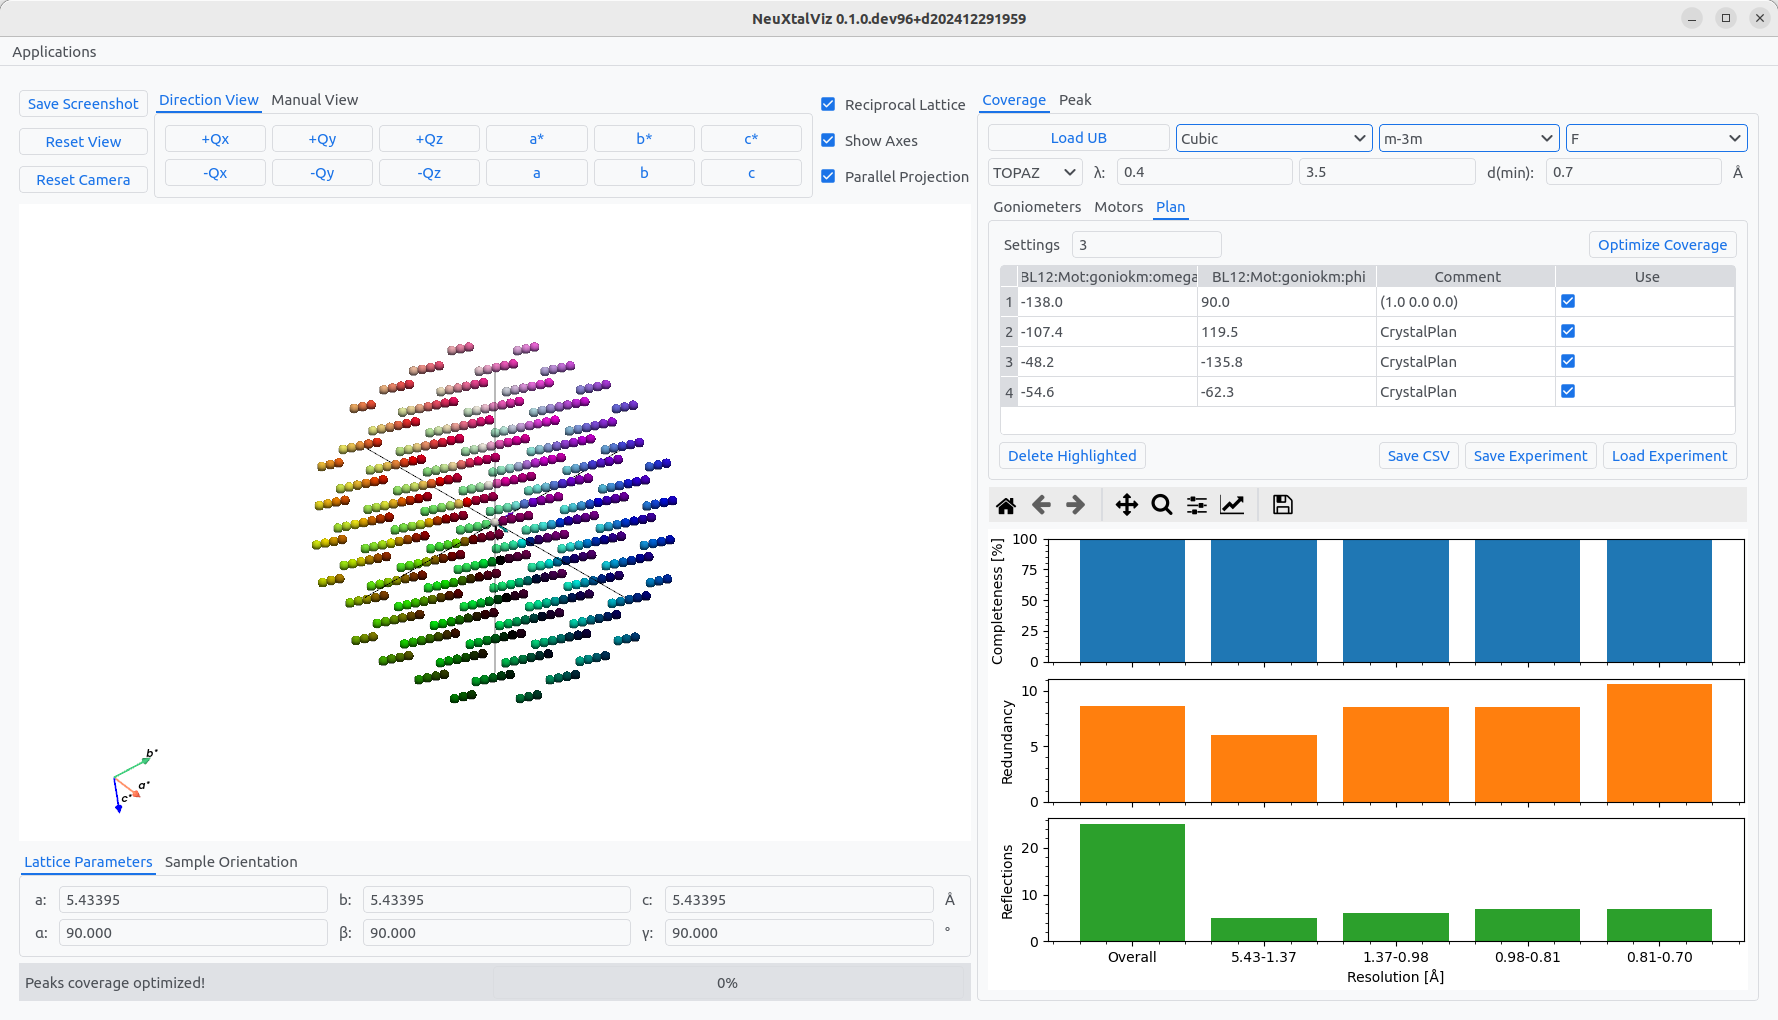
Optimizing coverage with point group symmetry.#

